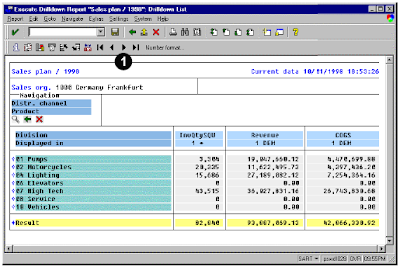
SAP ABAP FICO report about profitability analysis provides a contribution margin for distribution channels, divisions, and products. Only planned data is displayed for the contribution margin. This plan can be used to provide fore casted data to marketing as well as to sales and operations planning .A product line manager would use this report to project the anticipated performance of specific divisions and products and possibly to submit this budget to a vice-president. Actual data can be compared against plan data, and a plan can be developed using manual estimates, or formulas in which previous historical performance is taken into consideration.
You must set the Controlling Area before running the report. Choose Accounting → Controlling → Cost centers → Profitability analysis → Environment → Set operating concern. For the examples in this section, the operating concern is set to IDEA using cost-based profitability analysis.
All reports in profitability analysis are user-defined. This means you must configure and generate the operating concern before creating any reports and determine the rows, columns, variables, and general format by using drilldown reporting (forms and reports).
You do not need to enter selection options for this report. All options are already hard-coded in the report. This means that only 1998 data is available. If you need to run a report for a different year, you must create a new report or define the period and fiscal year characteristics as variables within the report configuration.
The profitability analysis line items which list are context-sensitive. For example, when you position the cursor on a cell for a line item, only the reports that contain that line item show data. This improves performance of the report as a whole.
Once the original profitability analysis document appears, the original documents related to the line item can be retrieved. For example, from a sales document, a material master, customer master, billing document, and accounting document is available. From a direct financial entry, however, only the cost element and accounting documents are available. From settlement documents, the controlling object from which the settlement took place is generally available.
Two different views are available in this report:
1. Selected columns run across the report, while the characteristics (products, for example) run down the side.
2. All columns for a single selected product show as rows for a contribution analysis.
You can analyze data using ranking lists, exception reporting, and sorting; list line items in the profitability analysis database; and access additional SAP data from this report.
This report contains data obtained from postings to cost-based CO-PA. As such, the data cannot be changed or manipulated from the report. Since cost-based—not account-based—CO-PA is used, value fields are used in the analysis instead of account numbers or cost elements.
Sample code and screens :
A product manager wants to analyze the projected contribution margin of a particular product based on the anticipated distribution channel through which the products will be sold.
To access the first screen for this report, choose Information systems → Accounting → Profitability analysis Profitability report → Report selection.
From the reporting tree, choose the following report:
Absatzplan → Sales Plan/1998.
The default sales organization number (for example, 1000) cannot be changed.
Divisions show in rows. In this example, all postings were assigned to a division. If postings were not assigned to a division, Not assigned would appear in the last row.
Planned data for fiscal year 1998 shows in columns.
1. Choose Next columns.

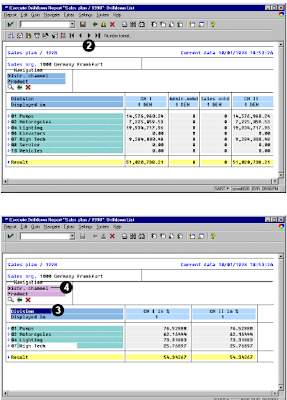
This screen shows additional planned data for fiscal year 1998.
2. Choose Next columns.
This screen shows additional planned data for fiscal year 1998.
3. Click once on the header field, Division.
4. Click once on the Distr. Channel characteristic in the Navigation section.
 The distribution channels list in rows.
The division is an available characteristic, but it has not been selected. Therefore, all distribution
channels list.
5. Click the diamond next to the first listed distribution channel, 10.
The diamond and navigation bars change color to indicate hotspot activation.
6. Choose Display .
Columns show as rows for the selected distribution channel.
7. Choose Scroll Down .

Related Posts:
What is SAP R/3 introduction to mysap.com
FICO sap abap reporting
abap fico profitability analysis and customer analysis
No comments :
Post a Comment