SAP ABAP Human Resource Payroll Journal Report

The flexibility of this SAP ABAP HR report allows you to create earnings registers, deduction registers, or other miscellaneous payroll registers for a given payroll period.This report only runs for employees with valid payroll results. You must answer the following three questions on the selection screen before running the report.

1. For which special run or period must the evaluation be started?

Pay period selection criteria are used for gathering data in this report. You must specify a payroll area and a specific pay period in which to select employees. You may also indicate if a special payroll run should be considered.

2. For which employees must the evaluation be started?

Specific employee numbers may be entered to further limit the data selected. Additional selection fields may be made available using the Further Selections button.

3. Which layout is required for the result of the evaluation?

The payroll journal consists of four individual forms which must be configured by the user:

1. Page header: The page header appears at the beginning of each printed page.
2. Employee data excerpt: Employee data excerpts appear on detail pages as a means of displaying individual employee’s payroll results.
3. Continuation excerpt: If the system begins a new page when printing the employee data excerpt, it prints this form (a mini-header for the employee) on the new page before printing the remainder of the employee data excerpt. Additional control functions appear on the selection screen to provide special handling for retroactive payroll runs (for example, printing on separate versus the same page).
4. Totals block: A totals block appears on the totals page below the page header. This form has the same function on the totals pages as the employee data excerpts on the detail pages.

You may select an alternate currency on the selection screen. You may alter the output of the data by configuring the system’s standard forms to produce a payroll register, earnings register, and deduction register.

This SAP ABAP report includes :

1. Variants
2. Execution (and print) in background
3. Standard selection fields
4. Additional selections fields (use the Further Selections or Matchcodes buttons)
5. Data output settings (provides a summary or detailed information using configurable forms)

To access the first screen for this report, choose Human resources → Payroll → Subs. activities → Per payroll period → Lists/statistics → Payroll journal.
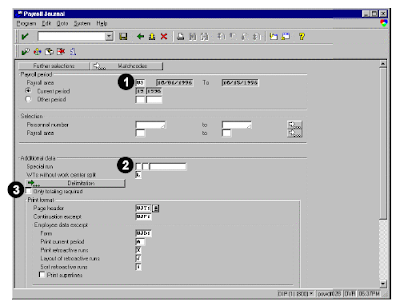
1. Enter US in Payroll area. When you choose Enter, the current pay period from the control record automatically appears.
2. Leave the Special run payroll type blank to indicate a regular payroll run.
3. Leave the Only totaling required field blank (as shown in this example) if you need employee
detail.
4. Under Print format, enter UJT1 in Page Header.
5. Enter UJF1 in Continuation excerpt.
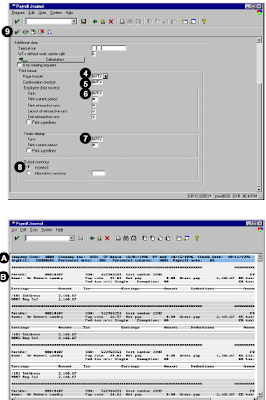
6. Under Employee data excerpt, enter UJD1 in Form.
7. Under Totals display, enter UJS1 in Form.
8. Under Output currency, select Inperiod.
9. Choose Execute.

A The data output header (shown on each page)
B Employee data (as defined in the detail form)

The corresponding screen shot is as shown.

C All key fields of the header and data totals
D Summary level (indicated by an asterisk (*). In this example, all personnel subareas are totalled for personnel area 3300.
E All key fields of the header replace with an asterisk (*) to indicate final totalling.
F The count of the employees selected and processed.


Related Posts:

ABAP HR head count report for sap
SAP ABAP FICO REPORT FOR GROUP CURRENCY RECONCILIATION

Organizational challenges in crm and mysap solutions
Business View and Mysap.com
What is SAP R/3 introduction to mysap.com
ABAP HR Head Count Report in SAP with screen shots

This SAP ABAP human resource (HR)report which is also called staffing level development report allows you to view detailed data at the personnel area (or subarea) and the employee group (or subgroup) levels. From this report, you can branch out into business graphics for a graphical representation of the data. This abap programming report, commonly referred to as the headcount report, is a personnel administration report. It counts the persons assigned to a payroll area in a certain pay period.

This report allows you to view detailed data at the personnel area (or subarea) and the employee group (or subgroup) levels. From this report, you can branch out into business graphics for a graphical representation of the data. This report, commonly referred to as the headcount report, is a personnel administration report. It counts the persons assigned to a payroll area in a certain pay period.

You must enter a value in the Payroll area to run this report. You may choose to use additional selection criteria to produce a more meaningful report. For example, you may want the report to list only those employees hired in a certain personnel area, employee group, and with a certain employment status, such as 1 for active employees. Selection criteria for the Payroll period are used to gather data for this report.

In HR, payroll accounting periods can vary in length (for example, monthly, weekly, etc.). Use Period modifier to identify the accounting period. To choose a period-length for this report (RPSDEV00), enter a specific period modifier in the Period modifier field. If the Period modifier field is left blank, the period modifier of the selected payroll area is used. The system chooses a key date for each period you enter. The data is shown for the specified key date (for example, the last day in the pay period).

As a default, the report data is summarized for all payroll areas. However, you can specify that the data be summarized at the personnel area, personnel subarea, employee group, and employee subgroup level.

There are no other reports available from this report. To automatically export the report data to Microsoft Excel®, Lotus 123®, or other spreadsheet tools, simply choose SAP XXL list viewer on the selection screen. To use this functionality, you must have the SAP-XXL component. Once the data is transferred you may determine control-breaks and form totals wherever required.

You may also transfer the displayed data to the SAP Business Graphics program. The interface to SAP Business Graphics can only process 31 lines at a time; if the list is longer than 31 lines, you will be prompted to compress the data using different options.

This ABAP report includes:

  1. Variants
  2. Execution (and print) in background
  3. Standard selection fields available
  4. Additional selection fields using Further Selections or Matchcodes
  5. Data output settings allowing for summary of data by personnel area, personnel subarea, employee group, and employee subgroup
  6. Chart functions using SAP Business Graphics: Functions → Chart (F8)
This report contains employee master data. As such, it cannot be changed or manipulated from the report.

To access the first screen for this SAP Programming report, choose Human resources → Personnel management → Administration → Reporting → Report selection → Organizational entity → Staff level development → Staffing level development.

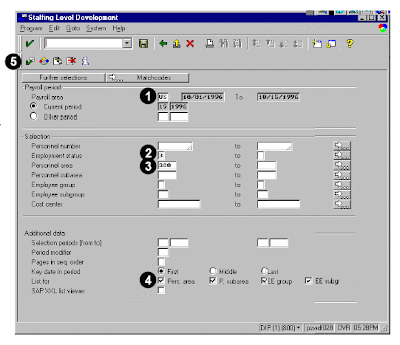
1. Enter US in Payroll area. When you choose Enter, the current pay period information is filled in from the control record.
2. Under Selection, enter 3 in Employment status. This limits your selection to active employees.
3. Enter 300 in Personnel area.
4. Under Additional data, select Pers. area, P. subarea, EE group, and EE subgr in List for.
5. Choose Execute.

This screen shows:

  • Selected personnel area
  • Summaries of each personnel subarea.
  • Number of employees in each employee group
  • Summaries of all subgroups
6. Choose Chart.

This screen shows a graphical display of the staffing level development with data groupings and a bar chart listing the exact numbers in each unit.

Related Posts:

SAP ABAP FICO REPORT FOR GROUP CURRENCY RECONCILIATION
fico reconcilation report for company code currency report
SAP ABAP FICO report about profitability analysis
SAP ABAP fico report profitability analysis report My sapcrm customers and consumer segmentation
Organizational challenges in crm and mysap solutions
Business View and Mysap.com
What is SAP R/3 introduction to mysap.com
SAP FICO Cross Company Code Reconciliation Report

The purpose of this sap abap finance and control report is to provides an overview of the reconciliation postings necessary to ensure that FI and CO postings made across company codes, business areas, and functional areas within the selected company code have been recorded to theGeneral Ledger (G/L), both on a period and a fiscal year-to-date basis. This report is specifically coded to pick up only cross-company code postings, not cross business area or cross-functional area postings.

The accounting department uses this report to ensure that financial and controlling transactions reconcile for CO postings that occur across company codes. Since cross-company code postings affect financial statements, this report monitors the expected reconciliation postings based on CO data, and the reconciliation postings made to FI.

You must enter a value in the selection fields before running this report. You may leave the company code selection blank, and obtain a list that contains values for all company codes for which reconciliation postings have been made. If you choose to use a group of company codes, you must first create a set that contains them in order to access Report Painter/Report Writer reports.

You can run a context-sensitive actual line item report from this reconciliation ledger report. For example, when positioning the cursor on a cell, only the line items that make up the cell total will appear. The actual line items for a reconciliation ledger report can be executed for either one cell, or a range of cells.

The system displays four columns for all sections of the report, including:

CO postings already made to the reconciliation ledger
FI postings already made to the reconciliation ledger
Variance between CO and FI postings
Reconciliation values still to be posted

By double-clicking on any subtotals in the report, the amount of detail that makes up the subtotal can either be hidden or displayed. For example, double-clicking on a cost element summary line will hide the debit/credit detail. To display this detail again, double-click on this line again.

This report contains data obtained from postings to the reconciliation ledger. This is a fixed special ledger to which postings are made when CO transactions span company codes, business areas, and functional areas. As such, the data cannot be changed or manipulated from the report.
The report contains two different blocks of data, as shown below. By navigating around these blocks, different types of reconciliation ledger data can be viewed.

To access the first screen for this report, choose Information systems → Accounting → Overhead costs and then, Cost elements → Report selection. From the reporting tree, choose the following report: Cost flow → Cross-company code → CElm: Company Code Allocations.

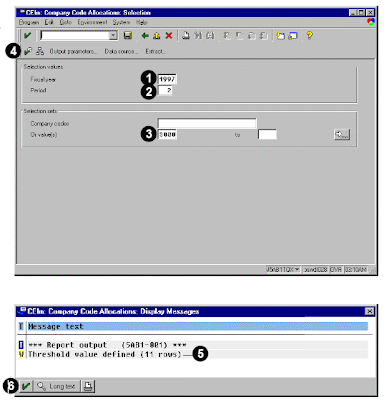
The displayed output consists of the following numbered data .

1. Enter 1997 in Fiscal year. This report runs for only one fiscal year at a time.
2. Enter 002 in Period. The report will show the reconciliation postings for the company code for
the selected period. In addition, the report will show a cumulative value of period 1 through the selected period.
3. Enter 3000 in Or value(s). You can also enter a range of company codes, or a company code group.
4. Choose Execute.

5. This display message indicates that 11 rows will be shown based on the threshold value defined within the report.Additional data may exist, but it will not be shown.
6. Choose Enter.


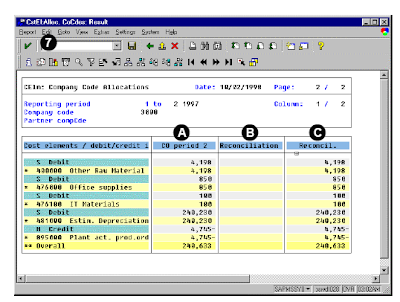
These rows show the cost elements and the debit/credit indicators of all postings to the reconciliation ledger.

A The CO period 2 column contains all CO postings made to the reconciliation ledger in period 002, in which allocations were made into and out of company code 3000.
B The Reconciliation column contains all postings to the reconciliation ledger made from FI.
C The Reconcil. column calculates the difference between the two columns. Non-zero values indicate values to be posted.
7. Choose Edit → Threshold value.

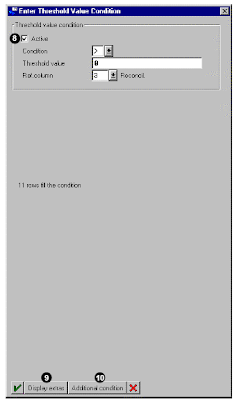
8. Make certain the threshold default Active is selected. This default specifies a row to appear only if the value in the variance column is greater than zero. If no row appears, there is no variance.

The lines that are suppressed are those in which there is no outstanding reconciliation posting to be made (a value of 0 in the Reconcil. column).
9. Choose Display extras.
10. Choose Additional condition.

Related Posts:


Business View and Mysap.com
What is SAP R/3 introduction to mysap.com
FICO sap abap reporting
abap fico profitability analysis and customer analysis