Showing posts with label fico reports. Show all posts

Product Cost Planning Overview

Tangible goods:Ÿ
Materials can be produced in-house, subcontracted, or procured externally. Data for these materials is located in the logistics components PP, PP-PI, and MM. This data is accessed when the materials are costed.Ÿ Product cost estimates can also be used for inventory valuation and for comparison purposes in Cost Object Controlling.

Intangible goods:
ŸShipping: Container repacking, storage, quality checking Ÿ Telecommunications: A one-minute long-distance call ŸConsulting: A two-day CO overview
ŸHospital: A heart operation
Training: A product training session at customer premises n Intangible goods are introduced in this course using the example of base object costing. Similar costing methods are provided for services in the form of a cost estimate without a quantity structure.

Goals of product cost planning

  1. What is the amount of the cost of goods manufactured and the cost of goods sold?
    Can we justify production at this market price? What is my lower price limit?
    From a cost accounting point of view, is it cheaper to produce in large or small lot sizes?
    How are the costs broken down? For example, how do the material costs compare to the wages?
    How could the production process be improved?
    Which organizational unit affects the product costs the most? In which plant can the product be manufactured the cheapest?
    What effect have machine depreciation and energy costs had on my product (primary costs)?
    In the SAP system, materials are valuated with one price. This price can be set by a standard cost
    estimate.
Product life cycle

At the start of the product's life cycle, only rough estimates and specifications are available. Product Cost Planning must be able to provide the first precise cost projections. These projections must be:
Delivered quickly
Ÿlexible and variable
Ÿade using existing, similar products or structures (where possible)
ŸWithout a large master data input.
During the product design and specification phase, the costs increase when refinements are made to the  original specifications.After the transition to the prototype stage, the first constructive data can be entered in the form of BOMs. During this phase, the need for integration and for direct access to the data in Logistics increases. Data not available in Logistics is added by the person responsible for product cost planning.
Once the products have reached market maturity, the integration of master data for tangible goods has a significant impact. At this stage, the complete product range is costed regularly, and precise cost shifts are monitored.Improvements in the production process of important products must be reflected by, and analyzed in, Product Cost Planning.

Methods

In the early stages of the product life cycle, unit costing and multilevel unit costing are the ideal costing methods due to the following:

Flexibility
ŸEfficient data maintenance
ŸUser can detail and refine the cost estimate as he or she wishes
Access to existing data and cost estimates in the system

When a cost estimate with quantity structure is created, the system uses master data from Logistics.This method costs individual products exactly, and provides various analysis options for comparing different alternatives.Costing runs are used for processing mass data. They are used periodically to cost the entire product spectrum.One of the focal points of this course is integration. Functions are introduced gradually. Consequently, the course materials are not designed to be used as a reference work. For a comprehensive reference work, refer to the SAP Library under Product Cost Planning.

Material cost estimates are saved with reference to a plant.Products produced in more than one plant have a separate cost estimate for each plant.To valuate material movements in Logistics, the system accesses the costing results. The valuation area determines the organizational level at which the material is valuated. To utilize material costing, therefore, it is mandatory that each plant is established as the valuation area.

Views in meterial master

Synonyms for the term material master are material, item master, product, and assembly.In costing, the material master is involved in the calculation of material costs and in updating prices. n The Accounting, Costing, and MRP views are relevant to costing.

Accounting view:
Relevant to material valuation, material price control, and account determination
ŸCosting view:Containsthe control parameters for material costing. Also contains characteristics required for Cost Object Controlling.To be able to cost a material, the Costing view must be maintained.

ŸMRP view: Material status in PP Scrap factors Special procurement 
Indicators: Co-product/Bulk material Production version


The material type determines whether a costing view is allowed for a material. It contains default values that are used when a material is created.Lot size . The lot size entered here is used as the default value for the material cost estimate. In individual processing, the lot size can be overwritten. In mass processing, it cannot be overwritten.

Valuation class. The valuation class controls the account determination. Here, the consumption account is determined, which also appears as the primary cost element in the itemization. Origin group as subgroup of a cost element. If an origin group has been entered for a material, the combination of origin group and cost element is updated in the CO system. You can thus define the following:

ŸOverhead for certain material groups, such as input material groups
ŸCost components for certain raw material groups
Overhead group: Key that groups the materials being manufactured for the same type of overhead application, depending on the product in question.

Material master prices

Planned Prices 1, 2 and 3. These can be maintained for raw materials and purchased parts, and used to valuate the materials in the cost estimate.Tax-based and commercial prices. These prices are entered for purchased parts in inventory costing for values such as the determination of lowest value. An inventory cost estimate can use these prices for valuation, and then update the costing results for finished and semi-finished products in these fields.

Price control. Indicator for price control, according to which the inventory of a material is valuated.The following options are available: 
Standard price.
ŸMoving average price.
A standard cost estimate can be used to update the standard price. You can branch from the accounting and costing views to the results of standard cost estimates. These results update the standard price.

Cost component split

The purpose of cost rollup is to ensure that the cost of goods manufactured (material and production costs) of all materials in a multilevel BOM are included in the cost estimate of the higher-level material. This is achieved by assigning the costs in a cost estimate to cost components. When a multilevel BOM is costed, the costs are rolled up. That is, the cost components of the cost component split are passed upwards in the hierarchy to the cost estimate of the higher-level material. For each material, the cost component split provides information on: 

The value added of the material (upper level).
ŸThe costs of the subordinate materials (lower level).
Up to 40 cost fields can be rolled up in a cost component split. A cost component can carry fixed and variable costs.

A cost component view consists of a combination of cost components according to various characteristics.It creates a filter in the Information System reports so that only data assigned to the view is displayed. In the cost estimate header, you can display up to 5 views as the initital costing result. You assign these views under the Settings menu in the cost estimate header.

Material cost elements

If you create more than one cost estimate for the same material, several business questions arise,such as:

What is the proportion of costs attributable to technical and organizational improvements?
Example: Use of current quantity structure and valuation at historical prices.Subsequent comparison with standard cost estimate.
What is the influence of changed raw material prices and potential wage increases?
Example: Use of historical quantity structure and valuation with current or future prices.Subsequent comparison with standard cost estimate. 
How are the current costs broken down?
Example: Current quantity structure with current prices.
"What if" analyses.
Example: Maintaining and valuating make-or-buy acceptances, prices, quantities and structures under a separate version.

Related Posts

SAP Reports in live Systems

Using the variation function, you can generate a report for every node and each single value in a hierarchy of characteristics used in the general data selection of a report. When using the variation function, you can interactively navigate within the hierarchy structure.If you want to use the variation function when outputting a report, you must specify this in the report definition.If the variation is used, you only need to carry out one selection run on the database for all reports produced. For this reason, the variation can often be used to reduce the system load.

Creating extracts

You can select and output data without creating an extract. Alternatively, you can decide to select the data and store it as an extract with or without outputting it.Once the data has been stored as an extract, you do not need to select it again. This means that the  time required to output an extract is considerably shorter. When you output an extract, all of the Report Writer functions such as defining threshold values and sorting lists are also available for use. These functions can also be used after a selection run via the database.


Each stored extract is identified by its report group and selection criteria.By choosing the data source, you can decide whether you want to display extracts (default), or select data from the database or from archive files. When you start a report, the system finds all the extracts that match the selection criteria you defined. If a report has been executed for a whole cost center hierarchy by using the variation, the system stores extracts for all cost center groups and single cost centers that are contained in that hierarchy. 

You can also execute reports in the background, so that in times of high system utilization additional processing time is not required.Once you release the background job, the system performs all additional steps without user intervention.For reports with large amounts of data, it is often advantageous to create an extract in the background and afterwards display and process the data online.

You can use mail to send reports within an R/3 system.After you send the report, it appears in the recipient's inbox. The recipient can list the name of the report group, the selection time, and additional information by selecting 'Display'. The report results are displayed using 'Process.'

Creating report interface

When displaying your report online, you can use data from a report in the report/report interface.Other reports are called up based on the corresponding selection criteria.You can specify the receiver reports in the header of every report group or in the library. You can use other Report Writer reports, transactions, report portfolio reports, drilldown reports, or ABAP programs as receiver reports.


Using the report/report interface, you can call up various reports while displaying your report data. The selection criteria used to call up the receiver report depend on the section marked in the sender report. Procedure for using the report/report interface:

Select the data to be analyzed in the sender report.
ŸThe receiver reports are displayed for selection.
ŸThe report/report interface also allows you to call up reports from other applications.

Creating activity group

Standard reports and reports you define can be installed in the reporting tree. End users can call up reports directly from the reporting trees.You can call up Report Writer reports, drilldown reports, transactions, ABAP, reports and report portfolio reports from the reporting tree.SAP delivers a preconfigured reporting tree for each application. If your user is assigned to one or more activity groups, you will receive your personal work center menu in the form of a tree control when you log onto the system. You can compile your own favorites in your work center menu by using drag & drop.SAP provides a series of standard activity groups. A user dependency relationship is set up by assigning area menus to activity groups or roles in the profile generator. In this case, authorizations are combined automatically.

In the activity group maintenance function (transaction PFCG), administrators can define the menu structure for an activity group and combine certain transactions, drill-down reports, ABAP reports,report portfolios, Internet/intranet links, and Report Writer report groups to form a user menu. The structure and terminology of the functions contained in the menu are freely definable. 

The transactions for the user menus can be entered directly, for example, from the SAP menu. In addition to the user menu, the overall view (SAP menu) contains all of the functions provided by SAP. This overall view, however, should only be used if user menus have not been defined yet or when the administrator wants to create new user menus.


Assigning users

An activity group can be assigned to any number of users.The activity group also contains authorizations that the users need to access the transactions, reports, and so on, in the menu.Authorizations can be created automatically for an activity group. Most of the field contents of these authorizations are defaulted by SAP. You can, however, modify these default values or add blank fields. You can then create an authorization profile automatically from these fields using the Profile Generator, and assign it to certain users.

The user menu only contains the entries - transactions, reports, and Web addresses - that are required for the user's day-to-day work. If your system administrator has defined a user me nu for you, it will be displayed automatically when you log onto the system.

Transport

Report Writer objects are client dependent objects.You can transport Report Writer objects between various SAP systems or between different clients. Report groups, reports, and models can be transported to these dependent objects from the Report Painter menu.You can transport Report Writer objects between different clients in the same SAP System in one step.Otherwise, you can use the alternatives: create an export file or create a transport request for transport to a different system.

Related Posts

SAP Financial and Controlling Complete Lessons

SAP Financial and controlling module is a vital part of ERP Module which will help you to get a full control over the business that a multinational organization.It has two sub parts named as Financial and controlling.Here we are going to make a detailed discussion in the following lessons.They are sub divided into multiple lessons which will help you to get complete understanding over the subject.Financial part help you to plan and manage the investments made by the company where as the controlling part leads about checks and balances in running the business.


SAP Financial Part One

System Functions and user Profiles in SAP Financials
 SAP Financial Accounting in Organizational Elements
 SAP Financial Master Data for General Ledger
SAP Financial Document Control
SAP Financial Post ControlSAP Financial Posting Tips
SAP Financial CurrenciesDealing with Taxes in SAP Financial
SAP Financial General Ledger Accounts
 SAP Financial Day to Day Planning
 SAP Financial Check Deposit Customizing

SAP Financial Part Two

SAP Financial Customer Vendor Accounts
 EnjoySAP Financial Invoice EntrySAP Financial Automatic Payments
SAP Financial General Ledger Accounts

 SAP Financial Customer and Vendor Accounts 
SAP Financial Open Item Clearing 
SAP Financial Correspondence 
SAP Financial Receivables 
SAP Financial General Ledger Special Transactions
 SAP Financial Credit Risk Management 
SAP Financial Reporting ToolsSAP Financial Closing Process

SAP Financial Part Three


SAP Financial Assets and Liabilities
 SAP Financial Profit and Loss 
SAP Financial Closing Process 
ASAP Implementation Road Map 
ASAP Project implementation and Realization 
SAP Financial Organizational Structure
 SAP Financial Master Data Depreciation Areas 
SAP Financial Asset Allocation 
SAP Financial Information System 
SAP Financial Legacy Data Transfer

 SAP Financial Part Four

SAP Financial and Controlling Overview
SAP Financial Master Data
 SAP Financial Event Based Posting
 SAP Financial Period End Posting 
 SAP Financial Planning
SAP Financial Internal Order Overview
SAP Financial Master DataSAP Financial Period End Closing
SAP Financial Profit Center Analysis
SAP Financial Special Purpose Ledger

SAP Financial Part Five

SAP Financial Cost Management
 SAP Financial Dunning 
SAP Financial Lock Box 
SAP Financial Interest Calculation
SAP Financial Payment Cards


SAP Controlling Part One


SAP Controlling and daily processing
 SAP Financial and Controlling Overview
SAP Controlling Information System
 SAP Financial Company OrganizationCustomizing 
SAP Controlling Creating General ledger accounts in sap controlling

 SAP Controlling Part Two

Creation of customer and vendor accounts
SAP Controlling Event Based Posting
Period end closing 
Order Summarization in sap controlling 
SAP Controlling Part Three
 
Complete Lessons


ABAP 51 Days Complete Course
ABAP Dictionary
OOPS in ABAP
BDC
SAP Scripts
SAP Scripts Controls
SAP Smart Forms
Real Time ABAP Programming Reports
SAP Interview Questions

SAP Financial Positng Tips

Reference paperwork, pattern documents, and the hold/set data perform all assist in reducing the number of entries vital in a new document.Reference paperwork are previously posted documents, which can be utilized as a template.Pattern paperwork are mannequin documents which can also be copied into a model new posting.The maintain/set data function permits for the automated getting into of certain knowledge when repeating a posting.When posting a document, it is typically easier to use a beforehand (or incessantly) used account assignment. This is finished with reference documents.

General Ledger Fast Entry

There's a separate screen for fast entry of G/L account line items.In regular line item posting, each line item requires a new display screen with the doable fields out there offered to the user. G/L quick entry uses line item templates which have only the predefined fields available. This limited selection is usually 1 or 2 lines in length, subsequently many line items match on the identical screen, making a number of line item entry much faster for standardized entries.In customizing it is potential to configure various entry templates to fulfill completely different finish user requirements.

The account task mannequin includes the road items that will probably be defaulted into.The account assignment mannequin can comprise an indefinite variety of line gadgets and embody the posted amount.he posted document.The posting in the account project model does not must be complete. For example, the account is perhaps included in the model whereas cost center and amount fields are left clean to be accomplished within the closing posting when the mannequin is used.Parameter ID's are used to determine the default worth for a subject in the person grasp record.Release.The advantage of this procedure for the consumer is that she or he no loner has to particularly enter a area value on the screen.

Example: If the person only has authorization for firm code 1000, the system mechanically enters the worth one thousand in fields that display firm code.

Parking Document

An incomplete doc may be parked and then posted at a later date; this can be performed by the same or a different user.One benefit of parking is you could evaluate the information in paperwork online for reporting functions from the moment they're parked, somewhat than having to attend till they have been accomplished and posted. For instance, you ought to use quantities from parked documents for the advance tax on sales/buy report.Substitutions and validations aren't supported whereas parking a document, however are supported when parked paperwork are completed and posted.Cash Management is updated inside preliminary posting. With every change, and when the parked document is posted, the money administration data is redetermined and up to date accordingly.The payables represented by parked paperwork might be displayed and posted in the Accounts Payable module. You even have the option of additionally together with parked paperwork in the doc journal and in the stories for open items.

You'll find a way to publish parked paperwork either individually or via a list. In the occasion you post a quantity of parked documents through a listing, the system issues a listing when you might have finished which particulars which documents have been efficiently posted.From this checklist you'll have the opportunity to then perform any obligatory publish-processing to any parked documents that couldn't be posted attributable to lacking important data similar to lacking account assignment. You possibly can additionally create a batch enter session to post the parked documents.

Recurring Account Program

For postings that recur regularly, such as payments for hire or curiosity, legal fees, and property taxes, you can use the recurring entry program to have the mandatory documents generated automatically.The recurring business transactions should be saved within the system as recurring entry authentic documents for this to be possible. Every recurring entry unique doc accommodates the date of the first and final posting, the frequency at which posting needs to be made, and the date of the subsequent deliberate posting.The recurring entry program have to be began at common intervals within a specified period. The program selects all recurring entry unique documents wherein the date of the following posting falls throughout the specified interval, after which generates a batch enter session.When the session is processed, an FI doc that corresponds to the original doc is posted, and the date of the subsequent posting is changed accordingly within the recurring entry original document.

Related Posts

SAP CRM Technology Overview
SAP Financial Document ControlSAP Financial Post Control

Reporting and Analysis for ERP SAP in Sales Order Process

We have lot of reporting and analysis tools available in ERP SAP and it is widely used in ABAP programming.The Sales Information System belongs to Sales and Distribution. With SIS, you can compress data from sales documents to obtain information which will help you make strategic business decisions. SIS contains standard analysis as well as flexible analysis to help you evaluate statistical data.

SAP provides list functions to create bin sales, delivery, picking, and billing.The Logistics Information Library allows you to integrate standard and flexible analysis as well as your own reports. You can structure and enhance the information library as you require. If the standard reports do not fulfill your requirements, you can use ABAP queries to extract information from the database into a report.

Lists fall into two categories.
Online lists which display, for example, sales, delivery, or billing documents for a customer, a material, or a combination of both.Other online lists display documents with a certain status that requires action from someone.

Worklists which allow you to select certain tasks in sales and distribution for processing. You select the tasks according to your area of responsibility and to various selection criteria.The Sales Information System is based on information structures. These are special statistic tables which contain transactional data from the different applications. This data is constantly collected and updated by the system.

Information structures contain three basic types of information:

Characteristics are criteria which you specify to collect data on a certain subject. In SD, you normally require sales information on sales organizations, sales offices, customers, and materials.A period unit is also a criterion used in information structures. You can collect data for a particular period, for example, for a day, a week, a month, or a posting period.

Key figures are performance measures. They provide important business information specific to a characteristic. Incoming order, sales volume, and returns, for example, are critical in SD.There are several standard information structures for Sales and Distribution available .You can use the standard analyses to evaluate data without having to make additional settings in Customizing.

There are also information structures available in the standard system for internal use: for example,information structures for Credit Management, Rebate Processing, Sales Support, or for processing contracts.

Alternatively, you can create your own information structures in Customizing using the name range S501 to S999.Standard analyses provide extensive functions to create sophisticated presentations and analyses for the data.

The analysis is based on the information structures. In the first step, you select the required data scope according to the characteristics and the period of the info structure. This data is displayed in an initial list. A variety of drill-down features are available in the lists. Each analysis can be saved.


You can call up the standard transactions directly from the current analysis to display, for example,master data or document information.You can use a wide range of tools to analyze the selected data and present the results. These include cumulative frequency curves, ABC analyses, time series, correlation, Top N evaluations, and other tools for comparison.

You can then graphically display this data.In addition, the results of the analyses can be printed,downloaded as a file to your local PC, downloaded into a spreadsheet program,sent to one or more employees using the SAP R/3 Office component.

Flexible analysis in the LIS allow you to determine the way in which data should be combined in an individual report procurement ,You define the form and the contents of the required list via the menu. The relevant program will then be generated in the background. The resulting list provides a variety of possibilities for interactive online processing.

This procedure enables you to combine characteristics and key figures from different information structures in one list ,use your own formulas to calculate new key figures from existing ones ,choose between a variety of layouts.

Related Posts:


Billing and payment process in erp sap abap

SAP FICO Cross Company Code Reconciliation Report

The purpose of this sap abap finance and control report is to provides an overview of the reconciliation postings necessary to ensure that FI and CO postings made across company codes, business areas, and functional areas within the selected company code have been recorded to theGeneral Ledger (G/L), both on a period and a fiscal year-to-date basis. This report is specifically coded to pick up only cross-company code postings, not cross business area or cross-functional area postings.

The accounting department uses this report to ensure that financial and controlling transactions reconcile for CO postings that occur across company codes. Since cross-company code postings affect financial statements, this report monitors the expected reconciliation postings based on CO data, and the reconciliation postings made to FI.

You must enter a value in the selection fields before running this report. You may leave the company code selection blank, and obtain a list that contains values for all company codes for which reconciliation postings have been made. If you choose to use a group of company codes, you must first create a set that contains them in order to access Report Painter/Report Writer reports.

You can run a context-sensitive actual line item report from this reconciliation ledger report. For example, when positioning the cursor on a cell, only the line items that make up the cell total will appear. The actual line items for a reconciliation ledger report can be executed for either one cell, or a range of cells.

The system displays four columns for all sections of the report, including:

CO postings already made to the reconciliation ledger
FI postings already made to the reconciliation ledger
Variance between CO and FI postings
Reconciliation values still to be posted

By double-clicking on any subtotals in the report, the amount of detail that makes up the subtotal can either be hidden or displayed. For example, double-clicking on a cost element summary line will hide the debit/credit detail. To display this detail again, double-click on this line again.

This report contains data obtained from postings to the reconciliation ledger. This is a fixed special ledger to which postings are made when CO transactions span company codes, business areas, and functional areas. As such, the data cannot be changed or manipulated from the report.
The report contains two different blocks of data, as shown below. By navigating around these blocks, different types of reconciliation ledger data can be viewed.

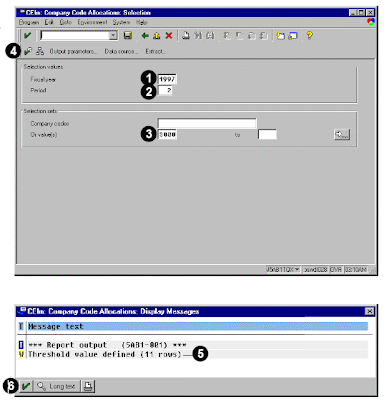
To access the first screen for this report, choose Information systems → Accounting → Overhead costs and then, Cost elements → Report selection. From the reporting tree, choose the following report: Cost flow → Cross-company code → CElm: Company Code Allocations.

The displayed output consists of the following numbered data .

1. Enter 1997 in Fiscal year. This report runs for only one fiscal year at a time.
2. Enter 002 in Period. The report will show the reconciliation postings for the company code for
the selected period. In addition, the report will show a cumulative value of period 1 through the selected period.
3. Enter 3000 in Or value(s). You can also enter a range of company codes, or a company code group.
4. Choose Execute.

5. This display message indicates that 11 rows will be shown based on the threshold value defined within the report.Additional data may exist, but it will not be shown.
6. Choose Enter.


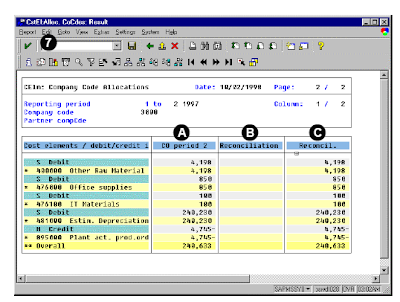
These rows show the cost elements and the debit/credit indicators of all postings to the reconciliation ledger.

A The CO period 2 column contains all CO postings made to the reconciliation ledger in period 002, in which allocations were made into and out of company code 3000.
B The Reconciliation column contains all postings to the reconciliation ledger made from FI.
C The Reconcil. column calculates the difference between the two columns. Non-zero values indicate values to be posted.
7. Choose Edit → Threshold value.

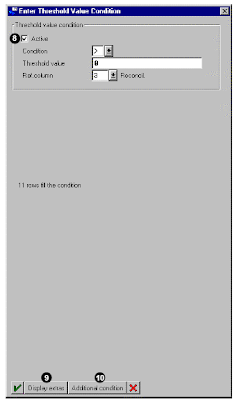
8. Make certain the threshold default Active is selected. This default specifies a row to appear only if the value in the variance column is greater than zero. If no row appears, there is no variance.

The lines that are suppressed are those in which there is no outstanding reconciliation posting to be made (a value of 0 in the Reconcil. column).
9. Choose Display extras.
10. Choose Additional condition.

Related Posts:


Business View and Mysap.com
What is SAP R/3 introduction to mysap.com
FICO sap abap reporting
abap fico profitability analysis and customer analysis

SAP ABAP FICO Report for Reconciliation in Group Currency

This SAP ABAP report about reconciliation in group currency provides an overview of the reconciliation postings necessary to ensure that FI and CO postings made across company codes, business areas, and functional areas within the selected company code have been recorded to the General Ledger (G/L), both on a period and a fiscal year-to-date basis. This report uses the group currency for the reconciliation, which in the example is the controlling area currency.

The accounting department uses this report to ensure that financial and controlling transactions reconcile for CO postings that occur across company codes, business areas, and functional areas. Since cross-company code postings affect financial statements, this report monitors the expected reconciliation postings based on CO data, and the reconciliation postings made to FI.

You must enter a value in the selection fields before running this report. You may leave the company code selection blank, and obtain a list that contains values for all company codes for which reconciliation postings have been made. If you choose to use a group of company codes, you must first create a set that contains them in order to access Report Painter/Report Writer reports.

You can run a context-sensitive actual line item report from this reconciliation ledger report. For example, when positioning the cursor on a cell, only the line items that make up the cell total will appear. The actual line items for a reconciliation ledger report can be executed for either one cell, or a range of cells.

The system displays four columns for all sections of the report, including:

  1. CO postings already made to the reconciliation ledger
  2. FI postings already made to the reconciliation ledger
  3. Variance between CO and FI postings
  4. Reconciliation values still to be posted

By double-clicking on any subtotals in the report, the amount of detail that makes up the subtotal can either be hidden or displayed. For example, double-clicking on a cost element summary line will hide the debit/credit detail. To display this detail again, double-click on this line again.

This report contains data obtained from postings to the reconciliation ledger. This is a fixed special ledger to which postings are made when CO transactions span company codes, business areas, and functional areas. As such, the data cannot be changed or manipulated from the report.

The report contains two different blocks of data, as shown below. By navigating around these blocks, different types of reconciliation ledger data can be viewed.

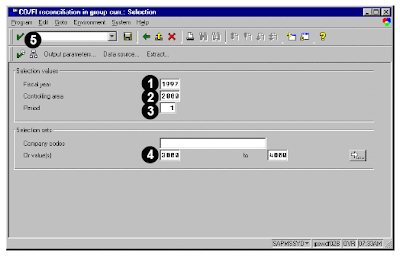
To access the first screen for this report, choose Information systems → Accounting → Overhead costs and then, Cost elements → Report selection.

From the reporting tree, choose the following report:

Reconciliation CO/FI → In group currency → CO/FI reconciliation in group curr.

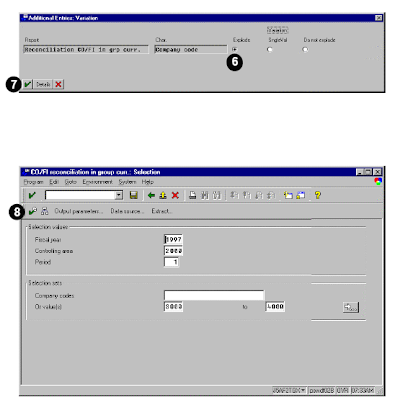
1. Enter 1997 in Fiscal year. This report runs for one fiscal year at a time.

2. Enter 2000 in Controlling area. This controlling area uses the group currency that reflects in the reconciliation report.

3. Enter 001 in Period. The report will show reconciliation postings for the company code in the selected period. In addition, the report will show a cumulative value of reconciliation postings of period 1 through the selected period.

4. Enter 3000 to 4000 in Or value(s). You may also enter a single company code, or a company code group.

5. Choose Variation

6. Make certain that the default Explode is selected. This results in data capture for hierarchy nodes, as well as for individual cost centers. Selecting the SingleVal option would only capture data for cost centers, with no totals for hierarchy nodes.

7. Choose Enter.

8. Choose Execute.

9. As the report runs, a threshold value determines the level of detail in the report output.

10. Choose Enter.

This screen shows the reconciliation accounts to which postings will be made from the reconciliation ledger. For primary cost elements, the system uses the same account. For secondary cost elements, the system determines the reconciliation account based on its configuration.

A CO postings to the reconciliation ledger
B FI postings to expense accounts
C Variance between the CO and FI postings
D Entries to the reconciliation ledger that have been made to FI (no values because the period-end process has not been executed)

11. Choose Variation .

12. Choose Field values on/off to list the company code and hierarchy node codes, in addition to their descriptions.

13. Double-click on the company code (for example, 3000) to display only the values relevant to it.

Related Posts:


Business View and Mysap.com
What is SAP R/3 introduction to mysap.com
FICO sap abap reporting
abap fico profitability analysis and customer analysis