This SAP ABAP human resource (HR)report which is also called staffing level development report allows you to view detailed data at the personnel area (or subarea) and the employee group (or subgroup) levels. From this report, you can branch out into business graphics for a graphical representation of the data. This abap programming report, commonly referred to as the headcount report, is a personnel administration report. It counts the persons assigned to a payroll area in a certain pay period.
This report allows you to view detailed data at the personnel area (or subarea) and the employee group (or subgroup) levels. From this report, you can branch out into business graphics for a graphical representation of the data. This report, commonly referred to as the headcount report, is a personnel administration report. It counts the persons assigned to a payroll area in a certain pay period.
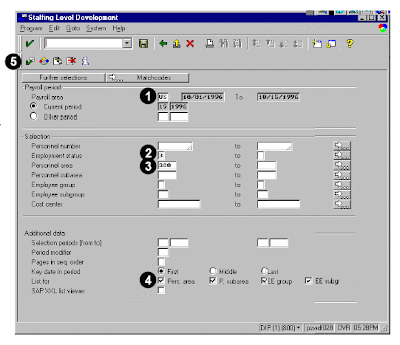
You must enter a value in the Payroll area to run this report. You may choose to use additional selection criteria to produce a more meaningful report. For example, you may want the report to list only those employees hired in a certain personnel area, employee group, and with a certain employment status, such as 1 for active employees. Selection criteria for the Payroll period are used to gather data for this report.
In HR, payroll accounting periods can vary in length (for example, monthly, weekly, etc.). Use Period modifier to identify the accounting period. To choose a period-length for this report (RPSDEV00), enter a specific period modifier in the Period modifier field. If the Period modifier field is left blank, the period modifier of the selected payroll area is used. The system chooses a key date for each period you enter. The data is shown for the specified key date (for example, the last day in the pay period).
As a default, the report data is summarized for all payroll areas. However, you can specify that the data be summarized at the personnel area, personnel subarea, employee group, and employee subgroup level.
There are no other reports available from this report. To automatically export the report data to Microsoft Excel®, Lotus 123®, or other spreadsheet tools, simply choose SAP XXL list viewer on the selection screen. To use this functionality, you must have the SAP-XXL component. Once the data is transferred you may determine control-breaks and form totals wherever required.
You may also transfer the displayed data to the SAP Business Graphics program. The interface to SAP Business Graphics can only process 31 lines at a time; if the list is longer than 31 lines, you will be prompted to compress the data using different options.
This ABAP report includes:
- Variants
- Execution (and print) in background
- Standard selection fields available
- Additional selection fields using Further Selections or Matchcodes
- Data output settings allowing for summary of data by personnel area, personnel subarea, employee group, and employee subgroup
- Chart functions using SAP Business Graphics: Functions → Chart (F8)
To access the first screen for this SAP Programming report, choose Human resources → Personnel management → Administration → Reporting → Report selection → Organizational entity → Staff level development → Staffing level development.
 1. Enter US in Payroll area. When you choose Enter, the current pay period information is filled in from the control record.
2. Under Selection, enter 3 in Employment status. This limits your selection to active employees.
3. Enter 300 in Personnel area.
4. Under Additional data, select Pers. area, P. subarea, EE group, and EE subgr in List for.
5. Choose Execute.
This screen shows:
- Selected personnel area
- Summaries of each personnel subarea.
- Number of employees in each employee group
- Summaries of all subgroups
This screen shows a graphical display of the staffing level development with data groupings and a bar chart listing the exact numbers in each unit.
 Related Posts:
SAP ABAP FICO REPORT FOR GROUP CURRENCY RECONCILIATION
fico reconcilation report for company code currency report SAP ABAP FICO report about profitability analysis
SAP ABAP fico report profitability analysis report My sapcrm customers and consumer segmentation
Organizational challenges in crm and mysap solutions
Business View and Mysap.com
What is SAP R/3 introduction to mysap.com
SAP FICO cross company code reconciliation report
A note to the sap abap readers:
A note to the sap abap readers:
I had started a new blog about retirement options for any individual and how to invest and earn money for a happy and early retirement at Rollover 401k and 401K IRA.Looking forward for your opinions.Thank you for the support.
No comments :
Post a Comment