SAP ABAP FICO Report for Reconciliation in Group Currency

This SAP ABAP report about reconciliation in group currency provides an overview of the reconciliation postings necessary to ensure that FI and CO postings made across company codes, business areas, and functional areas within the selected company code have been recorded to the General Ledger (G/L), both on a period and a fiscal year-to-date basis. This report uses the group currency for the reconciliation, which in the example is the controlling area currency.

The accounting department uses this report to ensure that financial and controlling transactions reconcile for CO postings that occur across company codes, business areas, and functional areas. Since cross-company code postings affect financial statements, this report monitors the expected reconciliation postings based on CO data, and the reconciliation postings made to FI.

You must enter a value in the selection fields before running this report. You may leave the company code selection blank, and obtain a list that contains values for all company codes for which reconciliation postings have been made. If you choose to use a group of company codes, you must first create a set that contains them in order to access Report Painter/Report Writer reports.

You can run a context-sensitive actual line item report from this reconciliation ledger report. For example, when positioning the cursor on a cell, only the line items that make up the cell total will appear. The actual line items for a reconciliation ledger report can be executed for either one cell, or a range of cells.

The system displays four columns for all sections of the report, including:

  1. CO postings already made to the reconciliation ledger
  2. FI postings already made to the reconciliation ledger
  3. Variance between CO and FI postings
  4. Reconciliation values still to be posted

By double-clicking on any subtotals in the report, the amount of detail that makes up the subtotal can either be hidden or displayed. For example, double-clicking on a cost element summary line will hide the debit/credit detail. To display this detail again, double-click on this line again.

This report contains data obtained from postings to the reconciliation ledger. This is a fixed special ledger to which postings are made when CO transactions span company codes, business areas, and functional areas. As such, the data cannot be changed or manipulated from the report.

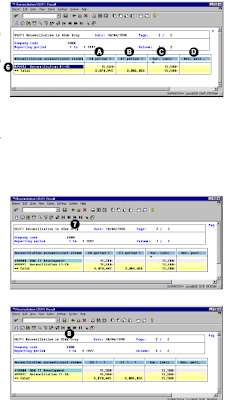
The report contains two different blocks of data, as shown below. By navigating around these blocks, different types of reconciliation ledger data can be viewed.

To access the first screen for this report, choose Information systems → Accounting → Overhead costs and then, Cost elements → Report selection.

From the reporting tree, choose the following report:

Reconciliation CO/FI → In group currency → CO/FI reconciliation in group curr.
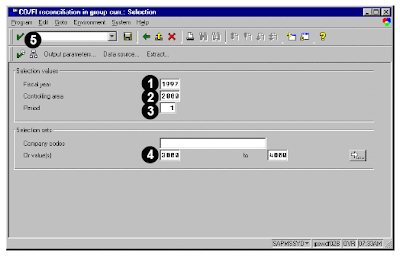
1. Enter 1997 in Fiscal year. This report runs for one fiscal year at a time.

2. Enter 2000 in Controlling area. This controlling area uses the group currency that reflects in the reconciliation report.

3. Enter 001 in Period. The report will show reconciliation postings for the company code in the selected period. In addition, the report will show a cumulative value of reconciliation postings of period 1 through the selected period.

4. Enter 3000 to 4000 in Or value(s). You may also enter a single company code, or a company code group.

5. Choose Variation

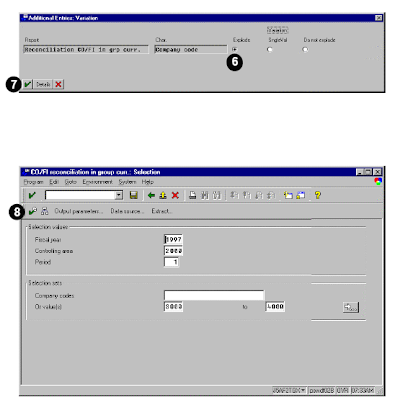
6. Make certain that the default Explode is selected. This results in data capture for hierarchy nodes, as well as for individual cost centers. Selecting the SingleVal option would only capture data for cost centers, with no totals for hierarchy nodes.

7. Choose Enter.

8. Choose Execute.
9. As the report runs, a threshold value determines the level of detail in the report output.

10. Choose Enter.

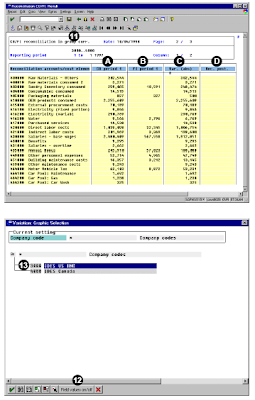
This screen shows the reconciliation accounts to which postings will be made from the reconciliation ledger. For primary cost elements, the system uses the same account. For secondary cost elements, the system determines the reconciliation account based on its configuration.

A CO postings to the reconciliation ledger
B FI postings to expense accounts
C Variance between the CO and FI postings
D Entries to the reconciliation ledger that have been made to FI (no values because the period-end process has not been executed)

11. Choose Variation .

12. Choose Field values on/off to list the company code and hierarchy node codes, in addition to their descriptions.

13. Double-click on the company code (for example, 3000) to display only the values relevant to it.
Related Posts:


Business View and Mysap.com
What is SAP R/3 introduction to mysap.com
FICO sap abap reporting
abap fico profitability analysis and customer analysis

SAP ABAP FI/CO Reconciliation in Company Code Currency Report

Reconciliation in Company Code Currency Report of SAP ABAP provides an overview of the reconciliation postings necessary to ensure that FI and CO postings made across company codes, business areas, and functional areas within the selected company code have been recorded to the
General Ledger (G/L), both on a period and a fiscal year-to-date basis. The company code currency is used for this reconciliation.

The accounting department uses this report to ensure that financial and controlling transactions reconcile for CO postings that occur across company codes, business areas, and functional areas. Since cross-company code postings affect financial statements, this report monitors the expected reconciliation postings based on CO data, and the reconciliation postings made to FI.

You must enter a value in the selection fields before running this report. You may leave the company code selection blank, and obtain a list that contains values for all company codes for which reconciliation postings have been made. If you choose to use a group of company codes, you must first create a set that contains them in order to access Report Painter/Report Writer reports.

You can run a context-sensitive actual line item report from this reconciliation ledger report. For example, when positioning the cursor on a cell, only the line items that make up the cell total will appear. The actual line items for a reconciliation ledger report can be executed for either one cell, or a range of cells.

By double-clicking on any subtotals in the report, the amount of detail that makes up the subtotal can either be hidden or displayed. For example, double-clicking on a cost element summary line will hide the debit/credit detail. To display this detail again, double-click on this line again.

This report contains data obtained from postings to the reconciliation ledger. This is a fixed special ledger to which postings are made when CO transactions span company codes, business areas, and functional areas. As such, the data cannot be changed or manipulated from the report.
The report contains two different blocks of data, as shown below. By navigating around these blocks, different types of reconciliation ledger data can be viewed.

To access the first screen for this sap abap report, choose Information systems → Accounting → Overhead costs and then, Cost elements → Report selection.

From the reporting tree, choose the following report: Reconciliation CO/FI → In company code currency → CO/FI Reconciliation in CCde Crcy.

1. Enter 1997 in Fiscal year. This report runs for only one fiscal year at a time.

2. Enter 1 in Period. This report shows the reconciliation postings for the company code in the selected period.
In addition, the report shows a cumulative value of the reconciliation postings from period 1 through the selected period.

3. Enter 3000 in Or value(s). You may also enter a range of company codes, or a company code group.

4. Choose Execute.
As the report begins to run, a threshold value determines how detailed the output will be.

5. Choose Enter.

This screen shows the reconciliation accounts to which postings will be made from the reconciliation ledger. For primary cost elements, the system uses the same account. For secondary cost elements, the system determines the reconciliation account based on its configuration.

A CO postings to the reconciliation ledger
B FI postings to expense accounts
C Variance between the CO and FI postings
D Entries to the reconciliation ledger that have been made to FI (no values because the period-end process has not been executed)

6. Double-click on the reconciliation account to reveal its field text.

This screen shows the original data that generated the variance between CO and FI, and which posts to the G/L from the reconciliation ledger.

7. Choose Next columns.

This screen shows a cumulative view of the same data. Since the selected period is also period 1, the values are the same.

8. Choose Previous columns to navigate to the first block of data displayed in the report.


Related Posts:

SAP ABAP FICO report about profitability analysis
SAP ABAP fico report profitability analysis report
My sapcrm customers and consumer segmentation
Organizational challenges in crm and mysap solutions
Business View and Mysap.com
What is SAP R/3 introduction to mysap.com

SAP ABAP FICO Profitability Analysis Report for Sales Plan

SAP ABAP FICO report about profitability analysis provides a contribution margin for distribution channels, divisions, and products. Only planned data is displayed for the contribution margin. This plan can be used to provide fore casted data to marketing as well as to sales and operations planning .A product line manager would use this report to project the anticipated performance of specific divisions and products and possibly to submit this budget to a vice-president. Actual data can be compared against plan data, and a plan can be developed using manual estimates, or formulas in which previous historical performance is taken into consideration.

You must set the Controlling Area before running the report. Choose Accounting → Controlling → Cost centers → Profitability analysis → Environment → Set operating concern. For the examples in this section, the operating concern is set to IDEA using cost-based profitability analysis.

All reports in profitability analysis are user-defined. This means you must configure and generate the operating concern before creating any reports and determine the rows, columns, variables, and general format by using drilldown reporting (forms and reports).

You do not need to enter selection options for this report. All options are already hard-coded in the report. This means that only 1998 data is available. If you need to run a report for a different year, you must create a new report or define the period and fiscal year characteristics as variables within the report configuration.

The profitability analysis line items which list are context-sensitive. For example, when you position the cursor on a cell for a line item, only the reports that contain that line item show data. This improves performance of the report as a whole.

Once the original profitability analysis document appears, the original documents related to the line item can be retrieved. For example, from a sales document, a material master, customer master, billing document, and accounting document is available. From a direct financial entry, however, only the cost element and accounting documents are available. From settlement documents, the controlling object from which the settlement took place is generally available.

Two different views are available in this report:

1. Selected columns run across the report, while the characteristics (products, for example) run down the side.

2. All columns for a single selected product show as rows for a contribution analysis.

You can analyze data using ranking lists, exception reporting, and sorting; list line items in the profitability analysis database; and access additional SAP data from this report.

This report contains data obtained from postings to cost-based CO-PA. As such, the data cannot be changed or manipulated from the report. Since cost-based—not account-based—CO-PA is used, value fields are used in the analysis instead of account numbers or cost elements.

Sample code and screens :

A product manager wants to analyze the projected contribution margin of a particular product based on the anticipated distribution channel through which the products will be sold.

To access the first screen for this report, choose Information systems → Accounting → Profitability analysis Profitability report → Report selection.

From the reporting tree, choose the following report:

Absatzplan → Sales Plan/1998.

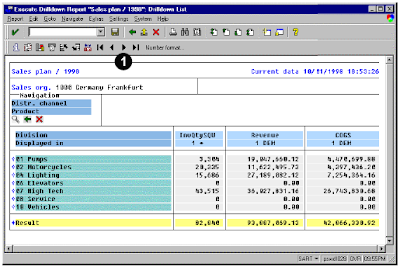
The default sales organization number (for example, 1000) cannot be changed.

Divisions show in rows. In this example, all postings were assigned to a division. If postings were not assigned to a division, Not assigned would appear in the last row.

Planned data for fiscal year 1998 shows in columns.

1. Choose Next columns.


This screen shows additional planned data for fiscal year 1998.

2. Choose Next columns.

This screen shows additional planned data for fiscal year 1998.

3. Click once on the header field, Division.

4. Click once on the Distr. Channel characteristic in the Navigation section.

The distribution channels list in rows.

The division is an available characteristic, but it has not been selected. Therefore, all distribution
channels list.

5. Click the diamond next to the first listed distribution channel, 10.

The diamond and navigation bars change color to indicate hotspot activation.

6. Choose Display .

Columns show as rows for the selected distribution channel.

7. Choose Scroll Down .


Related Posts:


What is SAP R/3 introduction to mysap.com
FICO sap abap reporting
abap fico profitability analysis and customer analysis
SAP ABAP Report FICO Profitability and Customer Analysis

This SAP ABAP report deals with finance and control department and is useful to get the Profitability analysis. This report compares sales quantities, gross revenues, and cost of sales for strategic business units, products, and customers. The characteristics available for product analysis include product hierarchies, industries, and divisions, which allow for a summarization of product lines for analysis.

A strategic business unit manager would use this report to monitor the performance of a portion of the business and to analyze which products and customers generate the most profits. Exception reporting and ranking allow quick identification of products that are exceptional performers, as well as poor performers, so that a unit manager can take steps to improve a product’s performance. These features also allow an analysis of the largest customers and the products they purchase, which is useful in planning targeted marketing initiatives for those customers.

You must set the Controlling Area before running the report. Choose Accounting → Controlling → Cost centers → Profitability analysis → Environment → Set operating concern. For the examples in this section, the operating concern is set to IDEA using cost-based profitability analysis.

All reports in profitability analysis are user-defined. This means you must configure and generate the operating concern before creating any reports and determine the rows, columns, variables, and general format by using drill down reporting (forms and reports).

Due to the configuration of this report, you must enter the date range and type of data. If planned data is run in this report, the version must also be specified. The record type is optional.

The profitability analysis line items which list are context sensitive. For example, when you position the cursor on a cell for a line item, only the reports that contain that line item show data. This improves performance of the report as a whole.

Once the original profitability analysis document appears, the original documents related to the line item can be retrieved. For example, from a sales document, a material master, customer master, billing document, and accounting document is available. From a direct financial entry, however, only the cost element and accounting documents are available. From settlement documents, the controlling object from which the settlement took place is generally available.

Two different views are available in this SAP ABAP report:

1. Selected columns run across the report, while the characteristics (products, for example) run down the side.

2. All columns for a single selected product show as rows for a contribution analysis.

You can analyze data using ranking lists, exception reporting, and sorting; list line items in the profitability analysis database; and access additional SAP data from this report.

This report contains data obtained from postings to cost-based CO-PA. As such, the data cannot be changed or manipulated from the report. Since cost-based—not account-based—CO-PA is used, value fields are used in the analysis instead of account numbers or cost elements.

To access the first screen for this report, choose Information systems → Accounting → Profitability analysis Profitability report → Report selection.

From the reporting tree, choose the following report: Istdaten → SBU → Product → Cust. w/out Summ. Levels.

Each term on the screen highlighted is having a meaning as mentioned.

1. Enter 001/1998 in Period from and 012/1998 in Period to. This report includes all periods for a fiscal year and allows reporting across fiscal years.

2. Enter data type 0 in Plan/act.ind.

3. Leave Version blank because it is only required for planned data.

4. Leave Record type blank so that all posted records appear. Record type limits the source of viewable data (for example, data only from invoices, or direct journal entries).

5. Choose Execute.

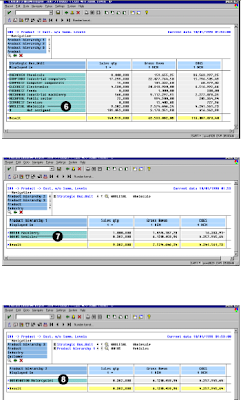
This screen shows data for the strategic business unit. Columns separate the sales quantity, gross revenue, and cost of sales. All postings not assigned to a division, appear in Not assigned in the last row.

6. Double-click on the Wholesale line to select it.

This screen shows the product hierarchy within Wholesale. The Strategic Business Unit is now displayed above the columns, so that the current selection of data is easily visible.

Notice that Product hierarchy 1 was the first characteristic in the Navigation section .

7. Double-click on Vehicles, the second Product hierarchy 1 value, to show the top-most characteristic listed in the Navigation section.

8. Double-click on Motorcycles, the only Product hierarchy 2 value.


Related Posts:

SAP ABAP fico report profitability analysis report 

 My sapcrm customers and consumer segmentation
Organizational challenges in crm and mysap solutions
Business View and Mysap.com
What is SAP R/3 introduction to mysap.com
FICO sap abap reporting

SAP FICO Profitability Analysis Plan and Actual Comparion

SAP FICO and in particular controlling wing ABAP report provides a contribution margin for divisions and products. Both actual and planned data list for the contribution margin, and a variance calculates for each value in it. This report summarizes revenues and contributions, and can do an in depth analysis of the margin for specific divisions or products.

A product line manager would use this report to monitor the performance of specific divisions and products and to identify the “bottom-line” impact of revenues and costs. Two features of this report, exception reporting and ranking, help to quickly identify both exceptional and marginal performers so that a product line manager can take immediate action to improve product performance.

You must set the Operating concern (but only when you first login). Choose Accounting → Controlling → Profitability analysis → Environment → Set operating concern. For the examples in this section, the operating concern is set to IDEA using cost-based profitability analysis.

All reports in profitability analysis are user-defined. This means you must configure and generate the operating concern before creating any reports and determine the rows, columns, variables, and general format by using drill down reporting (forms and reports).

Due to the configuration of this report, you must enter all selection options (that is, period range and fiscal year).

The profitability analysis line items which list are context sensitive. For example, when you position the cursor on a cell for a line item, only the reports that contain that line item show data. This improves performance of the report as a whole.

Once the original profitability analysis document appears, the original documents related to the line item may be retrieved. For example, from a sales document, a material master, customer master, billing document, and accounting document is available. From a direct financial entry, however, only the cost element and accounting documents are available. From settlement documents, the controlling object from which the settlement took place is generally available.

Two different views are available in this report:

1. Selected columns run across the report, while the characteristics (products, for example) run down the side.
2.All columns f or a single selected product show as rows for a contribution analysis.

You can analyze data using ranking lists, exception reporting, and sorting; list line items in the profitability analysis database; and access additional SAP data from this report.

This report contains data obtained from postings to cost-based CO-PA. As such, the data cannot be changed or manipulated from the report. Since cost-based—not account-based—CO-PA is used, value fields are used in the analysis instead of account numbers or cost elemets.

To access the first screen for this sap baap fico report, choose Information systems → Accounting → Profitability analysis Profitability report → Report selection.

From the reporting tree, choose the following report:

Plan- → Plan/Actual Comparison.

The initial screen looks like this in sap systems.
The numbers marked in the screen represent the following.

1. Enter 1 in From period and 12 in To period. This report will not provide a periodic breakdown of the costs, only totals for the period range.
2. Enter 1998 in From Fiscal Year. This report runs for only one fiscal year at a time.
3. Choose Execute.

The initial output of the report is as shown and each number of the output is explained as below.


The default sales organization number (for example, 1000) cannot be changed. Divisions show in rows. In this example, all postings were assigned to a division. If postings were not assigned to a division, Not assigned would appear in the last row.

Gross revenue and contribution margin data show in columns. For each of these values, planned and actual data appear, along with the absolute and percentage variances.

4. Double-click on the first division, Pumps. This screen shows the products within the Pumps division. Notice the breakdown of the Product characteristic as compared to the previous screen.
5. Choose Display to navigate to Division characteristic. This screen shows all Divisions.
6. Select the High Tech line.
7. Choose Enter.


Related Posts:

My sapcrm customers and consumer segmentation
Organizational challenges in crm and mysap solutions
Business View and Mysap.com
What is SAP R/3 introduction to mysap.com