This abap report with erp programming report facilitates the sales shipping point analysis by shipping point, route, forwarding agent, and destination country. When processing deliveries, the shipping point is the principal criterion used to select deliveries. This report is updated in the information structure S005 when a delivery has been made. You can create company specific information structures and update rules to specify different means of collecting and reporting order data.
You must use Period to analyze selection criteria to run this report. You should limit the selection criteria to reduce the run time for the report.
The selection screen of this report includes:
Variants
Dynamic selection options
User settings for drilldown reports, default key figures, and other reporting parameters
Execution
The output of this report includes:
Dynamic filtering of output (by column) after the program has been executed to narrow down the displayed results: Position the cursor in a column and choose Edit → Set filter (Ctrl+Shift+F2)
Sorting capability (by column): Select a column and choose Edit → Sort in ascending/descending order (Ctrl+Shift+F5/F4)
Column width optimization: Select a column and choose Settings → Columns → Optimize width.
This report contains data that is statistically summarized. Based on your system’s configuration, this data is updated online by sales events or periodically by batch programs. This data cannot be manipulated.
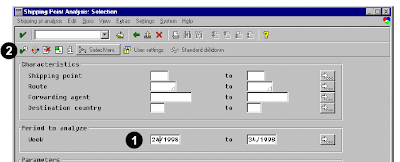
To access the first screen for this report, choose
Logistics → Sales and distribution → Sales information system → Standard analyses → shipping point.
1. Enter the 10-week period you wish to analyze (for example, 24/1998 to 34/1998) in Period to
analyze. A period is determined by the date an order item is entered or changed.
2. Choose Execute.
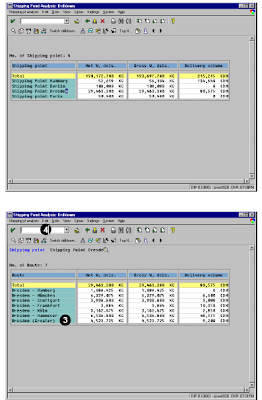
 This screen shows data based on the standard defaults for drilldown, key figures to be displayed, and other layout settings.
3. Double-click on a line item (for example, Dresden).
4. Choose Edit → Choose key figures to specify additional key figures or to change their sequence.
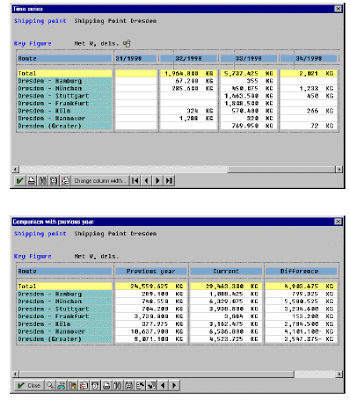
 The following functions (extract) are available to further analyze the displayed data:
This screen shows a comparison between previous year shipping and current shipping information from the Dresden shipping point.
 Related Posts:
SAP ABAP HR report for EEOC
ABAP Programming hr new hire report
SAP ABAP HR PAYROLL REPORT
ABAP HR head count report for sap
sales open deliveries abap programming report
You must use Period to analyze selection criteria to run this report. You should limit the selection criteria to reduce the run time for the report.
The selection screen of this report includes:
Variants
Dynamic selection options
User settings for drilldown reports, default key figures, and other reporting parameters
Execution
The output of this report includes:
Dynamic filtering of output (by column) after the program has been executed to narrow down the displayed results: Position the cursor in a column and choose Edit → Set filter (Ctrl+Shift+F2)
Sorting capability (by column): Select a column and choose Edit → Sort in ascending/descending order (Ctrl+Shift+F5/F4)
Column width optimization: Select a column and choose Settings → Columns → Optimize width.
This report contains data that is statistically summarized. Based on your system’s configuration, this data is updated online by sales events or periodically by batch programs. This data cannot be manipulated.
To access the first screen for this report, choose
Logistics → Sales and distribution → Sales information system → Standard analyses → shipping point.
1. Enter the 10-week period you wish to analyze (for example, 24/1998 to 34/1998) in Period to
analyze. A period is determined by the date an order item is entered or changed.
2. Choose Execute.
 This screen shows data based on the standard defaults for drilldown, key figures to be displayed, and other layout settings.
3. Double-click on a line item (for example, Dresden).
4. Choose Edit → Choose key figures to specify additional key figures or to change their sequence.
 The following functions (extract) are available to further analyze the displayed data:
- Sorting (+/-)
- Top N/Last N
- Time series (periods in columns)
- Comparing two key figures
- Comparing actual/plan
- Comparing current/last year
- ABC analysis
- Correlation/classification
- Graphics
This screen shows a comparison between previous year shipping and current shipping information from the Dresden shipping point.
 Related Posts:
SAP ABAP HR report for EEOC
ABAP Programming hr new hire report
SAP ABAP HR PAYROLL REPORT
ABAP HR head count report for sap
sales open deliveries abap programming report
No comments :
Post a Comment