SAP Finance and controlling ABAP report which deals with cost center summery is discussed here.
This SAP fico report is default in build report and you need not write any single line of ABAP code provides a summarized view of the costs, activities, and statistical key figures that are posted to cost centers. The report includes both planned and actual postings, and calculates an absolute variance (difference), as well as a percentage of the variance.
A cost center manager would use this report to view planned costs and to monitor the progress of actual activity against the plan. The report allows for a consolidated view of multiple cost centers. The balance of the cost center is calculated from the debits and credits posted to the cost center. Any balance remaining in a cost center before month-end processing, either an over- or under absorption of costs, is usually assessed to other cost centers or to profitability analysis.
To run this ABAP fico report, use one of the following access options:
1.Information systems → Accounting → Overhead costs
Cost centers → Report selection
From the reporting tree, choose the following report:
Plan/Actual Comparison → CCtr: Actual/Plan/Variance → CCtr: Actual/Plan/Variance
2.Choose System → Services → Reporting and enter J1SIPTEX in the Program field.
Then, choose Execute to run the report.
Prerequisite for this SAP FICO report:
You must set the Controlling Area before running the report. Choose Accounting →
Controlling → Cost centers → Environment → Set controlling area. For the examples in this section, the controlling area is set to 2000.
You must enter a value in the selection fields before running the report. You may leave the cost center and cost element selection blank, and get a list that contains values for all cost centers and all cost elements in the selected controlling area.
If you enter cost center groups and cost element groups, they must have already been set up. If they contain subtotals, hierarchy nodes should be created within the groups. Each hierarchy node then subtotals in this report.
You can run multiple context-sensitive reports from this SAP controlling cost center report. For example, when you position the cursor on a cell for planned costs, only the reports that contain planned costs list data. If you select a cell for planned costs and run a report that only contains actual data, no data lists.
The SAP system displays four columns for all sections of the report, including actual postings, planned data, and a calculation of the variance between the two, both as an absolute and as a percentage value (calculated by dividing the actual data by the planned).
By double-clicking on any subtotals in the report, the detail that makes up each subtotal can either be hidden or displayed. For example, double-clicking on the Internal activities line will hide the cost element detail. To display this detail again, double-click on this line.
Example with screen shots :
A cost center manager wants to analyze the detailed postings for a cost center, including all planned and actual costs, planned and actual activities, and planned and actual statistical key figures.
To access the first screen for thisABAP FICO report, choose
Information systems → Accounting → Overhead costs
Cost centers → Report selection.
From the reporting tree, choose the following report:
Plan/Actual Comparison → CCtr: Actual/Plan/Variance → CCtr: Actual/Plan/Variance.
The screen shot is as shown here.
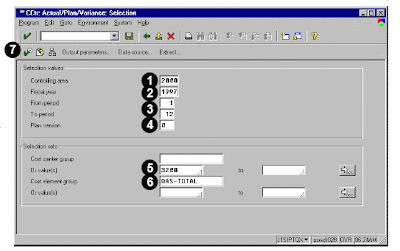 Each number of the screen shot is as explained below.
1. Under Selection values, enter 2000 in Controlling area.
2. Enter the year in Fiscal year (for example, 1997). This report runs for only one fiscal year at a time.
3. Enter 1 in From period and enter 12 in To period. This range includes all periods in the fiscal year.
4. Enter 0 in Plan version.
. Under Selection sets, enter 3200 in Or value(s). You can also enter a range of cost centers or a cost center group.
6. Enter OAS-TOTAL in Cost element group. This is the name of the group which contains all cost elements.
7. Choose Execute.
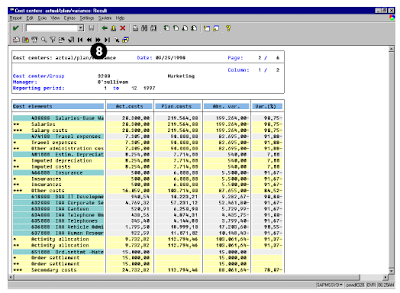
The output screens are as shown here.
The first screen of the report shows the cost elements, for which actual and planned costs are posted in the cost center.
Debits and credits are separated. If the cost element group contains hierarchy nodes, a subtotal is shown for each of these nodes. Absolute and percentage variances are also calculated.
Cost elements that are included in the cost element group, but for which no postings were made, are not shown.
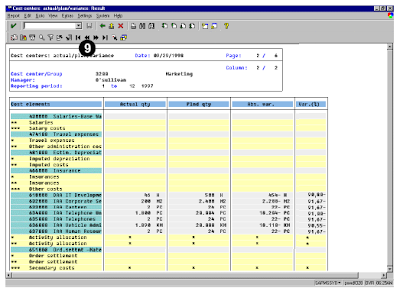
The next screen of SAP finance report shows the cumulative costs posted to both primary and secondary cost elements, along with the absolute and percentage variances.
These costs are all the costs that posted to the order during the current fiscal year through the selected period.
SAP finance report UPDATE
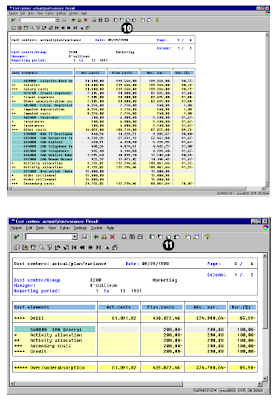
9. Choose Previous columns to view the previous screen.
 The previous screen appears.
10. Choose Page Down to view the remaining cost element data.
This section of the screen shows the remaining cost element data. For this example, all cost elements posted to the cost center did not fit on the previous screen.
11. Choose Page Down to navigate to the next block of data.
You may be also interested in the following SAP Finance reports.
SAP Finance General Ledger report account balance
Finance general ledger line items SAP ABAP report
General ledger report SAP FINACNE
This SAP fico report is default in build report and you need not write any single line of ABAP code provides a summarized view of the costs, activities, and statistical key figures that are posted to cost centers. The report includes both planned and actual postings, and calculates an absolute variance (difference), as well as a percentage of the variance.
A cost center manager would use this report to view planned costs and to monitor the progress of actual activity against the plan. The report allows for a consolidated view of multiple cost centers. The balance of the cost center is calculated from the debits and credits posted to the cost center. Any balance remaining in a cost center before month-end processing, either an over- or under absorption of costs, is usually assessed to other cost centers or to profitability analysis.
To run this ABAP fico report, use one of the following access options:
1.Information systems → Accounting → Overhead costs
Cost centers → Report selection
From the reporting tree, choose the following report:
Plan/Actual Comparison → CCtr: Actual/Plan/Variance → CCtr: Actual/Plan/Variance
2.Choose System → Services → Reporting and enter J1SIPTEX in the Program field.
Then, choose Execute to run the report.
Prerequisite for this SAP FICO report:
You must set the Controlling Area before running the report. Choose Accounting →
Controlling → Cost centers → Environment → Set controlling area. For the examples in this section, the controlling area is set to 2000.
You must enter a value in the selection fields before running the report. You may leave the cost center and cost element selection blank, and get a list that contains values for all cost centers and all cost elements in the selected controlling area.
If you enter cost center groups and cost element groups, they must have already been set up. If they contain subtotals, hierarchy nodes should be created within the groups. Each hierarchy node then subtotals in this report.
You can run multiple context-sensitive reports from this SAP controlling cost center report. For example, when you position the cursor on a cell for planned costs, only the reports that contain planned costs list data. If you select a cell for planned costs and run a report that only contains actual data, no data lists.
The SAP system displays four columns for all sections of the report, including actual postings, planned data, and a calculation of the variance between the two, both as an absolute and as a percentage value (calculated by dividing the actual data by the planned).
By double-clicking on any subtotals in the report, the detail that makes up each subtotal can either be hidden or displayed. For example, double-clicking on the Internal activities line will hide the cost element detail. To display this detail again, double-click on this line.
Example with screen shots :
A cost center manager wants to analyze the detailed postings for a cost center, including all planned and actual costs, planned and actual activities, and planned and actual statistical key figures.
To access the first screen for thisABAP FICO report, choose
Information systems → Accounting → Overhead costs
Cost centers → Report selection.
From the reporting tree, choose the following report:
Plan/Actual Comparison → CCtr: Actual/Plan/Variance → CCtr: Actual/Plan/Variance.
The screen shot is as shown here.
 Each number of the screen shot is as explained below.
1. Under Selection values, enter 2000 in Controlling area.
2. Enter the year in Fiscal year (for example, 1997). This report runs for only one fiscal year at a time.
3. Enter 1 in From period and enter 12 in To period. This range includes all periods in the fiscal year.
4. Enter 0 in Plan version.
. Under Selection sets, enter 3200 in Or value(s). You can also enter a range of cost centers or a cost center group.
6. Enter OAS-TOTAL in Cost element group. This is the name of the group which contains all cost elements.
7. Choose Execute.
The output screens are as shown here.
The first screen of the report shows the cost elements, for which actual and planned costs are posted in the cost center.
Debits and credits are separated. If the cost element group contains hierarchy nodes, a subtotal is shown for each of these nodes. Absolute and percentage variances are also calculated.
Cost elements that are included in the cost element group, but for which no postings were made, are not shown.

The next screen of SAP finance report shows the cumulative costs posted to both primary and secondary cost elements, along with the absolute and percentage variances.
These costs are all the costs that posted to the order during the current fiscal year through the selected period.
SAP finance report UPDATE
9. Choose Previous columns to view the previous screen.
 The previous screen appears.
10. Choose Page Down to view the remaining cost element data.
This section of the screen shows the remaining cost element data. For this example, all cost elements posted to the cost center did not fit on the previous screen.
11. Choose Page Down to navigate to the next block of data.

You may be also interested in the following SAP Finance reports.
SAP Finance General Ledger report account balance
Finance general ledger line items SAP ABAP report
General ledger report SAP FINACNE
No comments :
Post a Comment